The Sahara Desert
The Fennec Campaign
Key Findings
The Sahara Desert
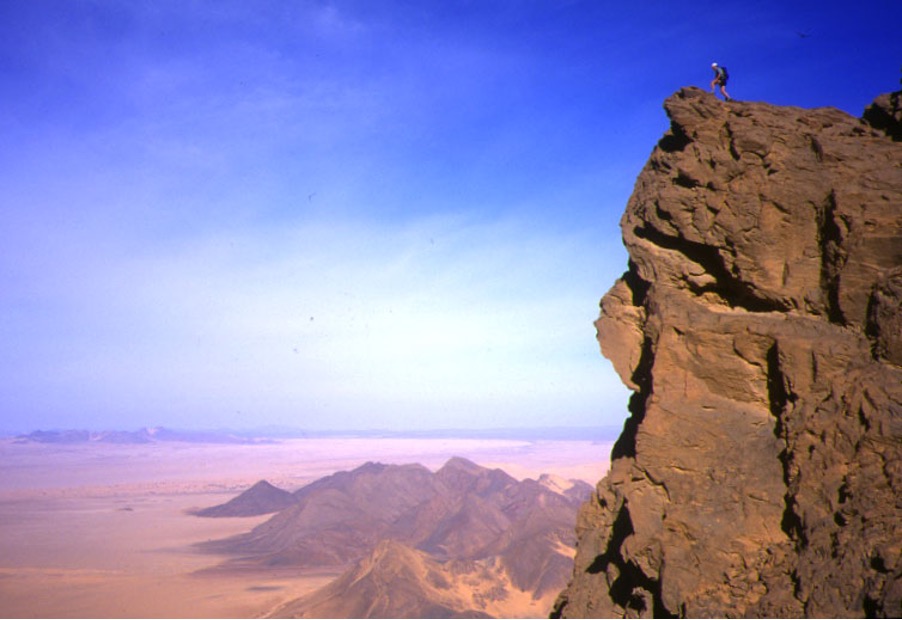
The Sahara Desert remains one of the most data-sparse regions on the planet. It is also a key driver of the climate system. During the boreal summer months intense surface heating leads to a heat low which is a critical part of the West African Monsoon system. The Sahara is also the largest source of mineral dust. Boreal summer Saharan dust emissions result from two atmospheric mechanisms acting over multiple dust sources: (i) the mixing down of momentum from low-level jets toward the surface after sunrise, (ii) high winds and turbulence at the leading edge of the cold pool outflows.
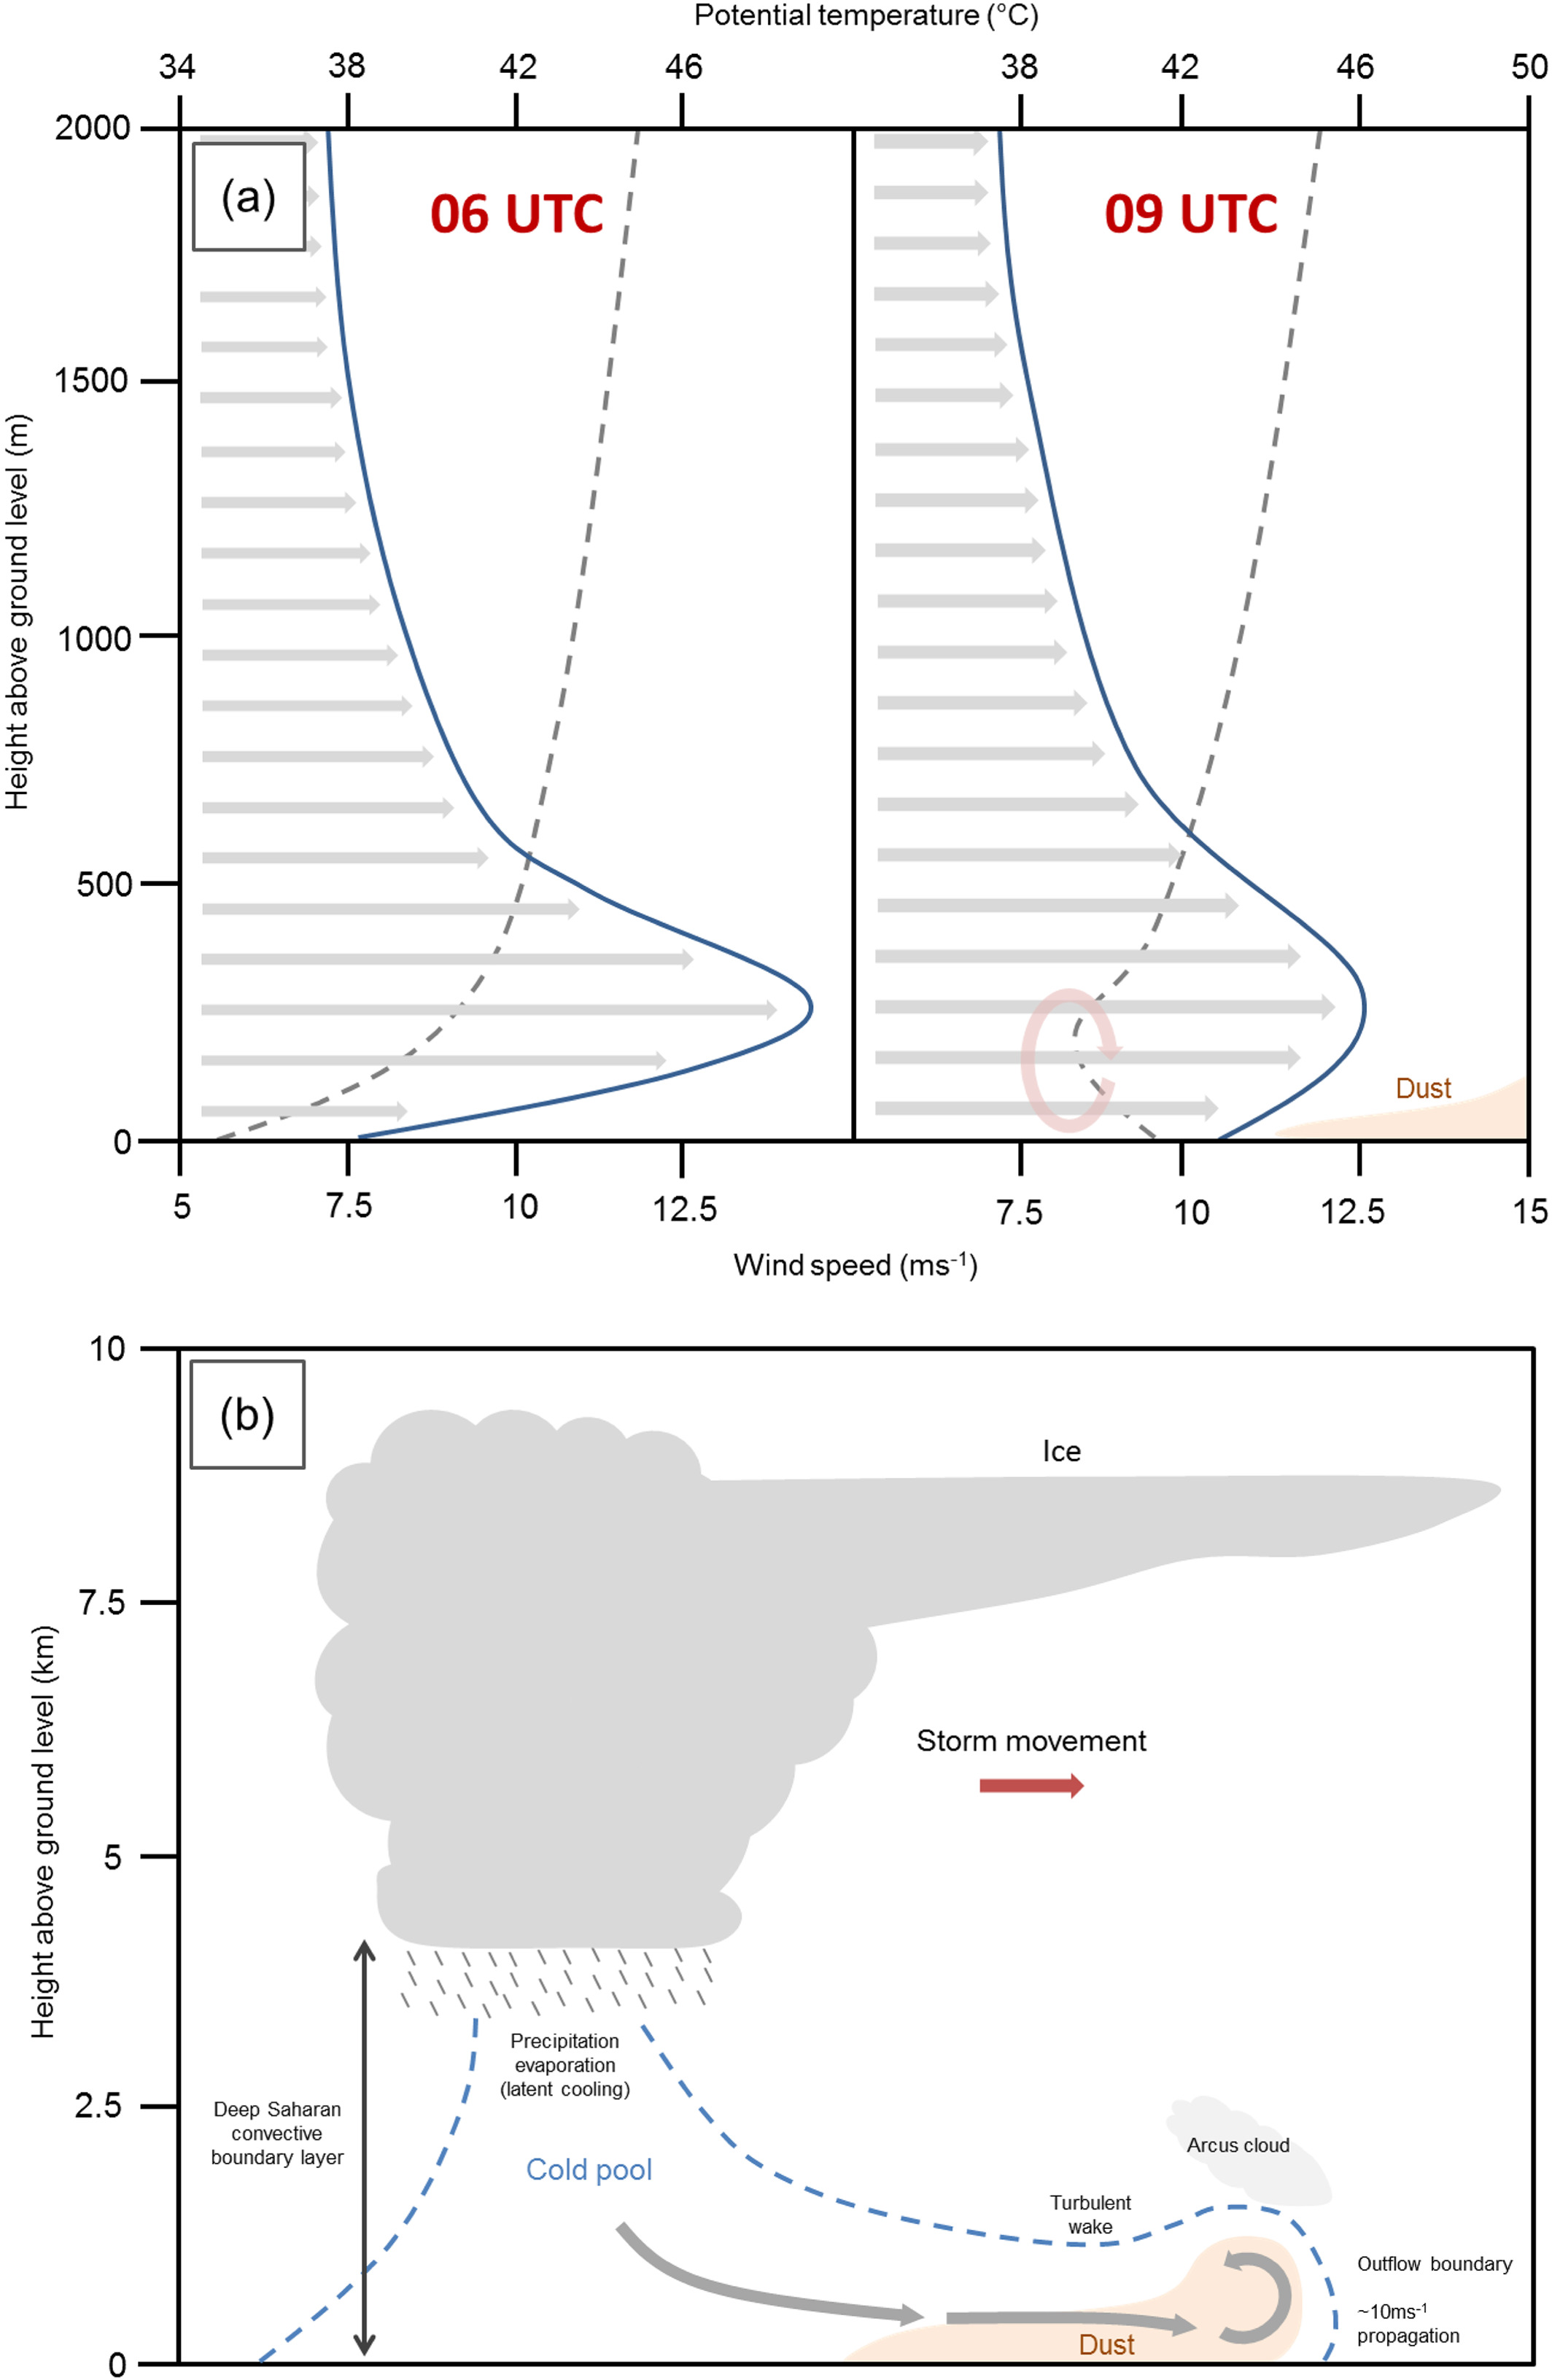
(a) shows the nocturnal low‐level jet as typical summertime central Saharan wind (solid blue) and potential temperature (dashed gray) profiles at 0600 UTC (left panel) and 0900 UTC (right panel). Convective turbulence in the morning mixes momentum from aloft to the surface, raising dust.
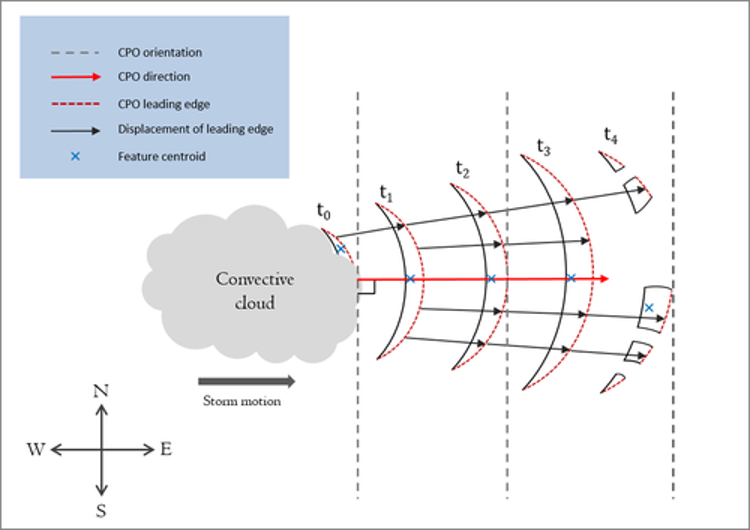
(b) shows the mechanics of a cold pool outflow associated with a mature convective system, with the cold pool region delineated in dashed blue. (See Caton Harrison et al., 2019 https://doi.org/10.1029/2019JD030291 for more details)
There are significant uncertainties in both the climate and numerical weather prediction models for this region. Progress in our understanding of dust emissions from the central Sahara have been hampered by a lack of high-quality ground-based observations.
This research group has followed two lines of work to try to solve the problem. First, the Fennec campaign which was led by the research group, led to the recovery of valuable observed data sets from ground-based instruments and aircraft. Second, the group has engaged with the development and analysis of satellite data sets.
The Fennec Campaign
Because of the remoteness and difficulty of working in the summertime central Sahara, direct observations of the climate system, including dust emission, has been very limited. Fennec was designed to gain observation from the data-sparse region in the core of the central Sahara.
The consortium project which involved the Met Office and several other UK universities, teamed up with the Algerian Met Service and the Mauritanian Met Service to instrument as much of the core of the central Sahara as funding allowed. The project would have been impossible without the generosity of these Met Services and the scientists and engineers who helped. Fennec was initially suggested by Doug Parker and Cyrille Flamant following their experience in AMMA.
Fennec included 3 observational components: airborne, satellite and ground based. The ground-based component comprised network or remote automatic weather station and two supersites: Zouerate, Mauritania and Bordj Badji Mokhtar.
The key aims of the Fennec program included the identification of mechanisms associated with dust emission and determining the contribution of these mechanisms to the total dust burden in the central Sahara region.

Key Findings
Allen, C. J. T., R. Washington, and S. Engelstaedter (2013), Dust emission and transport mechanisms in the central Sahara: Fennec ground-based observations from Bordj Badji Mokhtar, June 2011, J. Geophys. Res. Atmos., 118, 6212–6232, doi:10.1002/jgrd.50534.
- Using a suite of instruments including flux towers, nephelometer and Lidar from the core of the central Sahara, this paper shows for the first time, what mechanisms are responsible for dust emission in the largest dust source on earth.
- 45% of the dust over Bordj Badji Mokhtar is generated by local emissions in cold pool outflows. These cold pool outflows were associated with the West African Monsoon.
- Low-level jets are of tertiary importance, they are responsible for 14% of dust over Bordj Badji Mokhtar.
- Climate models run at global scale cannot currently simulate cold pool outflows and this has major implications for Sahara dust simulation since the main mechanism is not represented in the models.
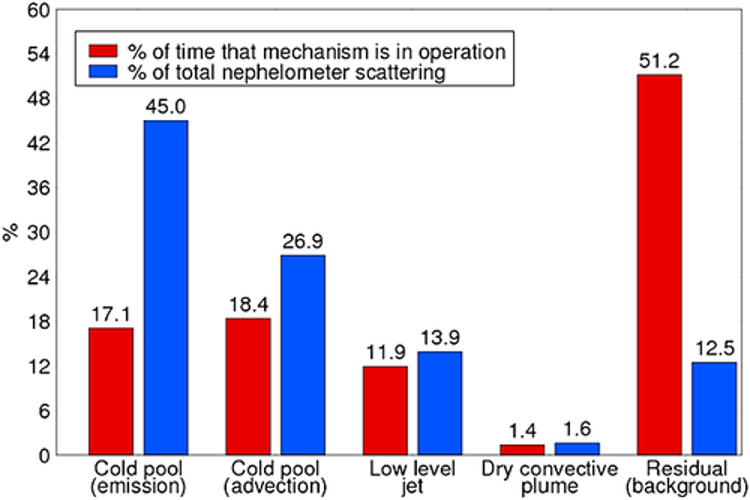
Blue bars represent the percentage of the total nephelometer scattering each mechanism is responsible for. The residual is defined as the background dust loading, i.e., periods when nephelometer scattering is less than 2 × 10⁻⁴ m−1 and when no dust events are identified. There is no overlap between any of the categories. The numbers above the bars are the percentage each bar represents, included for clarity. Since the whole duration of the Fennec Intensive Observation Period is represented, the values of the blue and red columns sum to 100
Ashpole, I., and R. Washington (2013), Intraseasonal variability and atmospheric controls on daily dust occurrence frequency over the central and western Sahara during the boreal summer, J. Geophys. Res. Atmos., 118, 12,915–12,926, doi:10.1002/2013JD020267.
- Dust emissions tend to come from the location close to the Algeria-Mali-Niger border triple point (TP) or further to the northwest across the western half of the Mali-Algeria border (MAB). There is an interseason progression of dust emission from the TP to MAB.
- Analysis of climatological composites demonstrates that monsoon surges into the Saharan heat low are associated with days of high dust detection frequency, while strong Harmattan winds into the central and western Sahara are linked to days with less frequent dust presence. The atmospheric budget from June-August is therefore strongly linked to the dynamics of the West African Monsoon.
Ashpole, I., and R. Washington (2013), A new high-resolution central and western Saharan summertime dust source map from automated satellite dust plume tracking, J. Geophys. Res. Atmos., 118, 6981–6995, doi:10.1002/jgrd.50554.

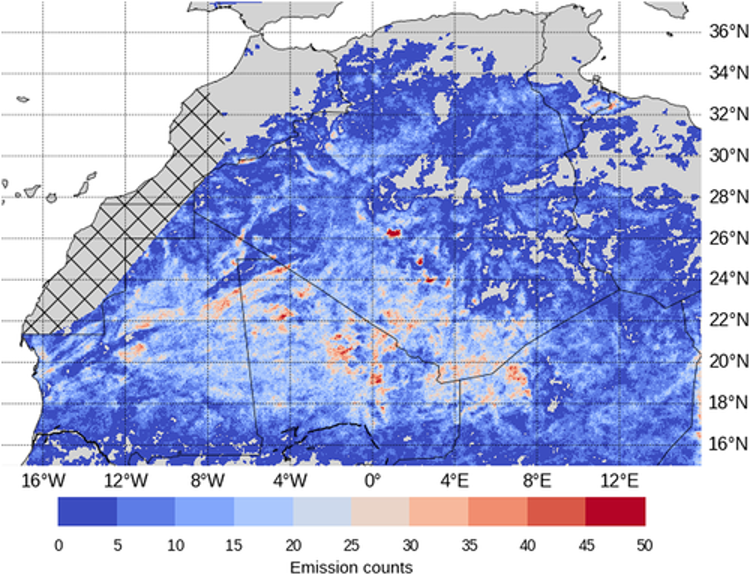
- This paper provides a new dust source detection method for the central and western Sahara, based on the automated identification of dust from satellite (Spinning Enhanced Visible and Infrared Imager – SEVIRI).
- Using a smart algorithm, the automated dust detection is tracked through 15 minute intervals ‘backwards’ to the source region where the dust is first detected.
- The new map shows that many dominant sources are likely to be associated with paleolakes and outwash plains.
- There is an analysis of the transport direction of dust plumes is 2 key domains, one in southwest Algeria and northwest Mali (characterised by transport towards the southwest and therefore likely to be dominated by low-level jets) and the second in southern Algeria, northwest Niger, and northeast Mali (here there are no preferred transport direction and an association between dust events and deep convection which points towards cold pool outflows as the likely deflation mechanism).

Allen, C. J. T., and R. Washington (2014), The low-level jet dust emission mechanism in the central Sahara: Observations from Bordj-Badji Mokhtar during the June 2011 Fennec Intensive Observation Period, J. Geophys. Res. Atmos., 119, 2990–3015, doi:10.1002/ 2013JD020594.
- Presents observations of Saharan low-level jets from the Fennec ground-based observations at Bordj-Badji Mokhtar, and demonstrates the diurnal cycle of the low-level jet. Core wind speeds of the jet start to decay at 0600, 15mins after surface temperatures began to increase.
- There is a clear association shown between jets and the strength and position of the Saharan Heat Low. Reanalysis data tends to underestimate these large scale features and hence the low-level jets are also underestimated.
- Low-level jet properties associated with dust emission quantified. Only the deepest and strongest low-level jets lead to dust emission when momentum from the core wind mixes down to the surface.

Allen, C. J. T., R. Washington, and A. Saci (2015), Dust detection from ground-based observations in the summer global dust maximum: Results from Fennec 2011 and 2012 and implications for modeling and field observations, J. Geophys. Res. Atmos., 120, 897–916, doi:10.1002/2014JD022655.
- Central Saharan dust storms of June 2011 and 2012 compared from Fennec observations
- In both years emission by cold pool outflows from deep convection causes the most dust. This is then followed by dust advection, monsoon surges, low-level jets and dry convective plumes.
- Due to the importance of cold pool outflows it is important that they are incorporated in dust modelling efforts over the region. This is problematic for current numerical modelling, as configurations without explicit convection struggle to generate cold pool outflow.
- As cold pool outflows frequently occur at night and with cloud cover, instruments that can monitor in these conditions are valuable in this region. Lidars and nephelometeres are therefore particularly useful.
Rocha-Lima, A., Martins, J.V., Remer, L.A., Todd, M., Marsham, J.H., Engelstaedter, S., Ryder, C.L., Cavazos-Guerra, C., Artaxo, P., Colarco, P. and Washington, R. (2018) A detailed characterization of the Saharan dust collected during the Fennec campaign in 2011: in situ ground-based and laboratory measurements. Atmospheric Chemistry and Physics, 18(2), pp.1023-1043.
- Ground-based in situ measurements of Saharan dust were obtained during the Fennec campaign in 2011.
- There were 2 main sites, one in Algeria and one in Mauritania, where dust samples were collected. The results show that the sampled dust has low absorption characteristics and exhibits a distinct spectral bow-like shape.
- There are distinctive differences in the composition and optical characteristics of the dust from the two sites – this agrees with previous studies that not all Sharan dust is the same.
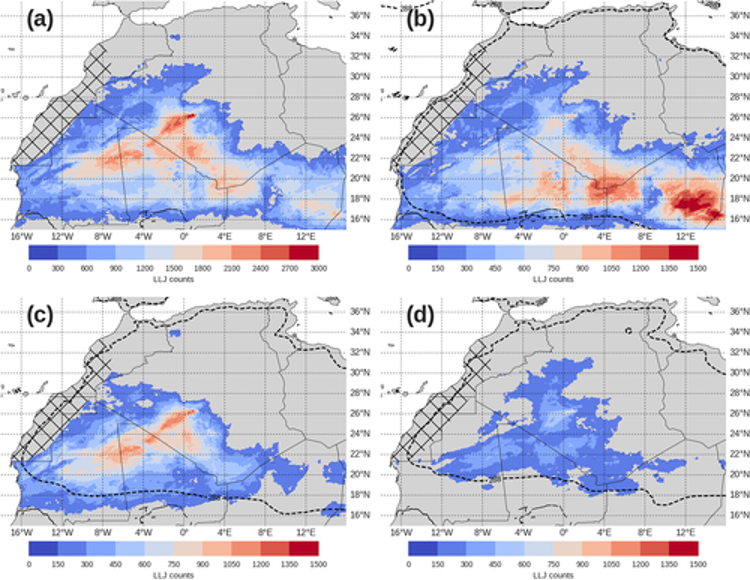
Caton Harrison, T., Washington, R.,& Engelstaedter, S. (2019). A 14-year climatology of Saharan dust emission mechanisms inferred from automatically tracked plumes. Journal of Geophysical Research: Atmospheres, 124, 9665–9690. https://doi.org/10. 1029/2019JD030291
- A novel method is developed to identify emission mechanisms from automatically tracked dust plumes in the central and western Sahara, building on from the method in Ashpole et al. (2013).
- Dust plumes across 14 summers are tracked and classified probabilistically as low-level jet of cold pool outflow events. An automated inference method tracks the timing, convective association and geometry of plumes observed in satellite data, it is from these characteristics that the dust events are classified.
- 82% of dust pixels are associated with cold pool outflow events, but low-level jets dominate the highly active Tidihelt Depression of central Algeria.
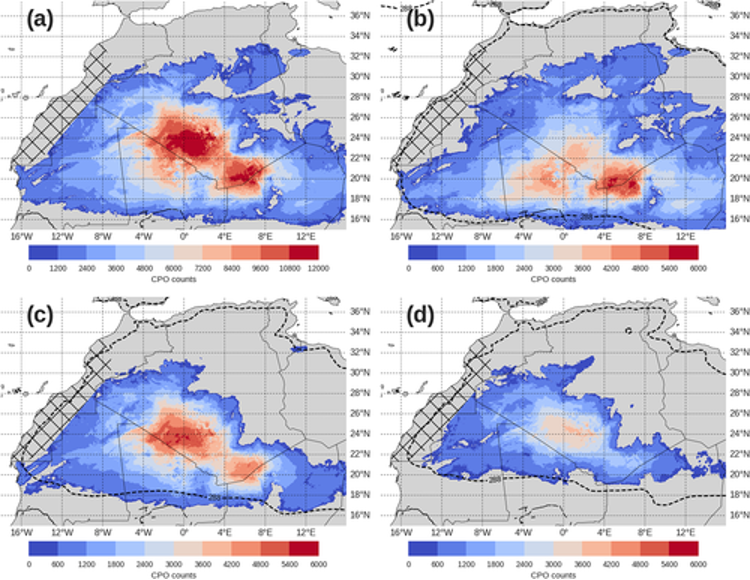

Caton Harrison, T., Washington, R.,& Engelstaedter, S. (2021). Satellite- derived characteristics of Saharan cold pool outflows during boreal summer. Journal of Geophysical Research: Atmospheres, 126, e2020JD033387. https://doi.org/10.1029/2020JD033387
- Cold pool outflows (CPO) are widespread across central and western Sahara, these peak in August close to the Mali-Niger-Algeria triple point.
- The absence of CPO from numerical models and reanalysis used to simulate Sahara dust emissions causes considerable errors in the modelling of dust flux.
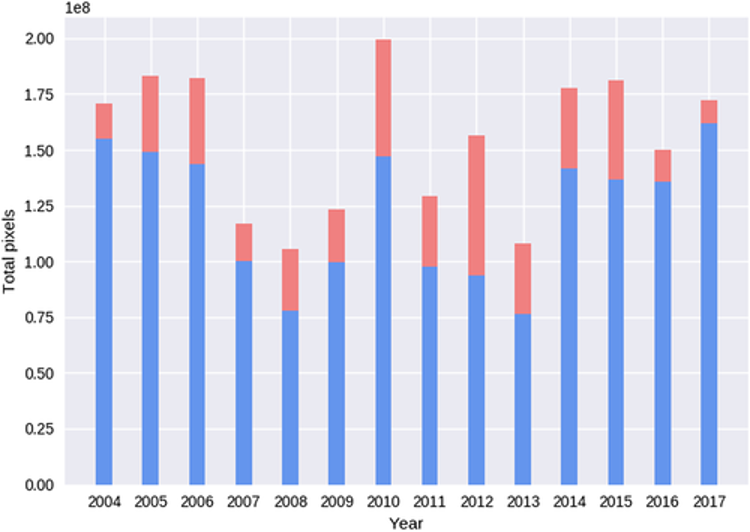
- 1559 events were tracked for June, July and August 2004-2017.
- A satellite detection and tracking scheme is developed and used to characterise Saharan CPO across 14 summers – this approach is found to flag 74.2% of events which are identified manually.
- CPO follow a clear diurnal cycle – peak at 1700-1900.
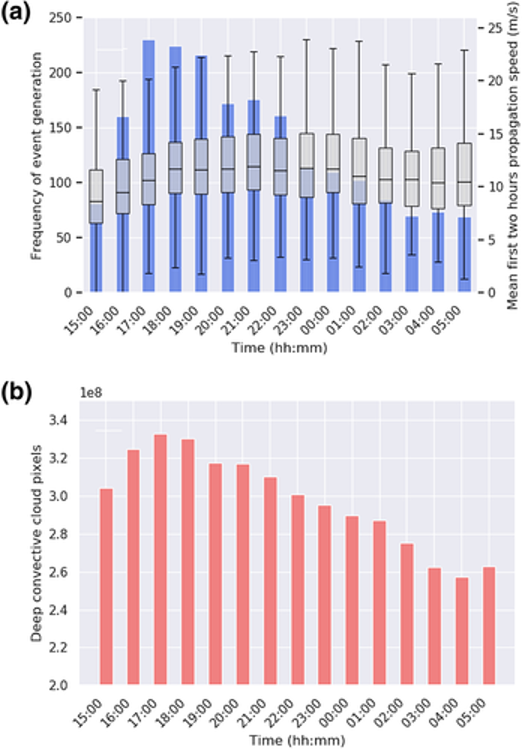
- Events are overwhelmingly northwestwards propagating
- 351 events (22.5%) exceed 300 km in distance from source
- CPO activity shifts north through the summer, patterns of CPO activity can help to explain and observed decline in late summer dust emissions.

